Razni testovi- Writing sekcije

IELTS test
task1
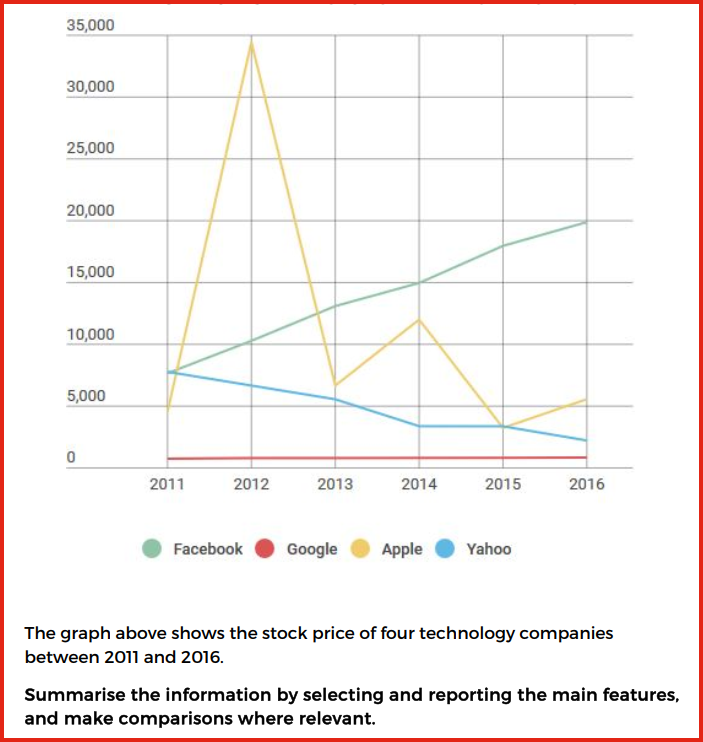
The line graph displays the stock values of four different high-tech corporations from 2011 to 2016.
Overall, Facebook’s value steadily increased, while Yahoo’s decreased. Apple’s stock price fluctuated wildly throughout the period and Google’s stayed relatively unchanged.
Facebook started the period with a stock market valuation of approximately 7,500 and this consistently moved up in value year on year to reach a peak of around 20,000 in 2016. Yahoo began the recorded period with a very similar value to Facebook, but in contrast, its stock devalued every year, until it reached a low of about 2,500 in 2016.
Apple stock was valued at just below 5,000 in 2011 and this jumped dramatically to nearly 35,000 the following year, before plummeting to around 7,000 in 2013. It recovered slightly in 2014 to around 12,000 and subsequently fell to a price of just over 5,000 in 2016. Google’s shares remained at around 1,000 for the entire period.
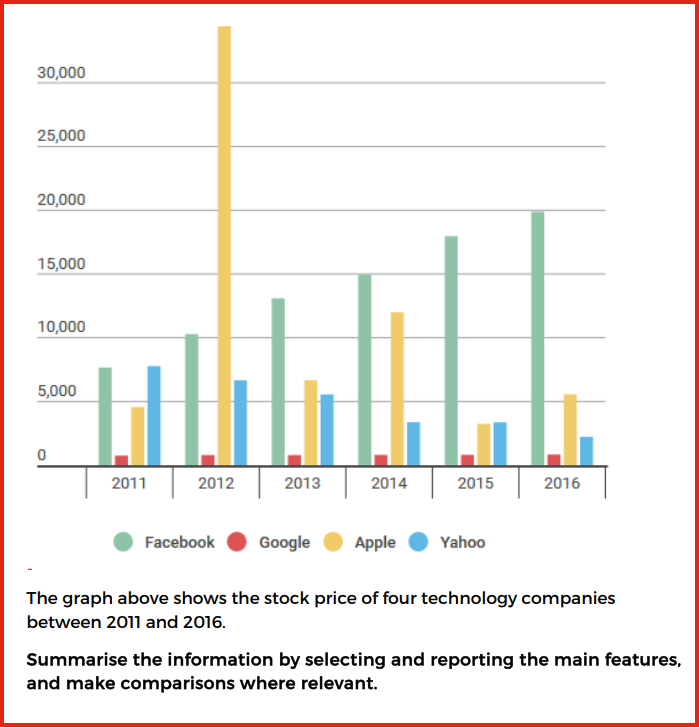
The graph displays the stock values of four different high-tech corporations from 2011 to 2016.
Overall, Facebook’s value steadily increased, while Yahoo’s decreased. Apple’s stock price fluctuated wildly throughout the period and Google’s stayed relatively unchanged.
Facebook started the period with a stock market valuation of approximately 7,500 and this consistently moved up in value year on year to reach a peak of around 20,000 in 2016. Yahoo began the recorded period with a very similar value to Facebook, but in contrast, its stock devalued every year, until it reached a low of about 2,500 in 2016.
Apple stock was valued at just below 5,000 in 2011 and this jumped dramatically to nearly 35,000 the following year, before plummeting to around 7,000 in 2013. It recovered slightly in 2014 to around 12,000 and subsequently fell to a price of just over 5,000 in 2016. Google’s shares remained at around 1,000 for the entire period.
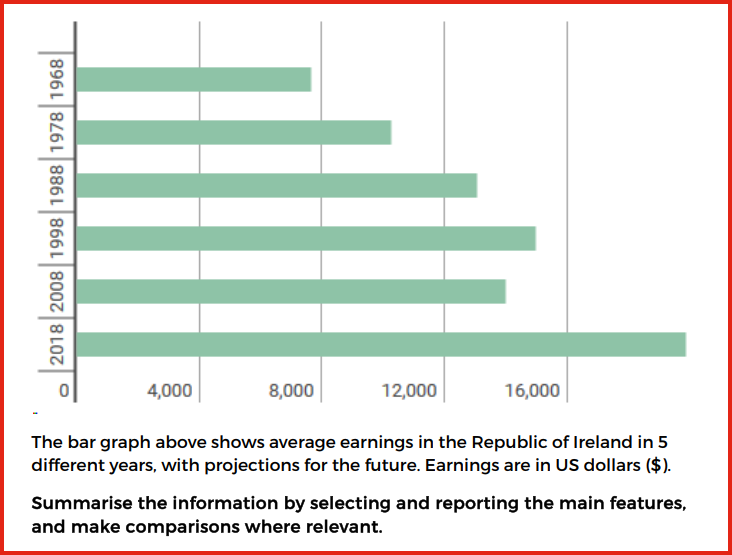
The bar chart displays the average salary in the Republic of Ireland in 5 different years with an estimated value for 2018. The unit of currency is in United States dollars.
Overall, it can be clearly seen that wages consistently increased in every recorded time period, except 2008, when they decreased slightly. Salaries are expected to increase significantly in the future.
Average earnings in 1968 stood at their lowest recorded levels at just under $8,000 and they then increased a decade later to around $10,000 in 1978. This trend continued in 1988 with the average income climbing to approximately $13,000. 10 years later, in 1998, it further improved to its highest recorded value of about $15,000.
The only notable exception to this expansion in levels of pay was 2008 when wages decreased by around $1,000 from the peak of 1998. However, this trend is not expected to continue in the future with projections of over $20,000 forecast for 2018.
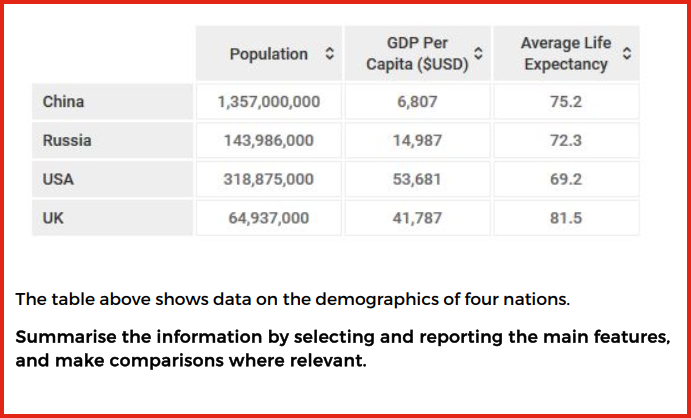
The table provides key information about the population, gross domestic product per person and life expectancy in four different countries.
Overall, there are two very noticeable features. Firstly, China has by far the highest number of citizens, but they have the lowest economic output per person out of the four powers. Secondly, the United States has the highest earnings, but the lowest life expectancy.
China has the highest number of people with around 1.3 billion citizens, however, the average person only produces $6,807 and the Chinese average age upon death is 75.2 years. This is in contrast with the USA where people earn, on average, nearly 10 times more than a normal man or woman from China. Despite this, Americans live significantly shorter lives at just 69.2 years.
The United Kingdom has the lowest population of the four countries with just under 65 million, but notably has the second highest GDP and the highest life expectancy with $41,787 and 81.5 years respectively. Russia has a population of nearly 144 million and a relatively low GDP per capita of nearly $15,000.
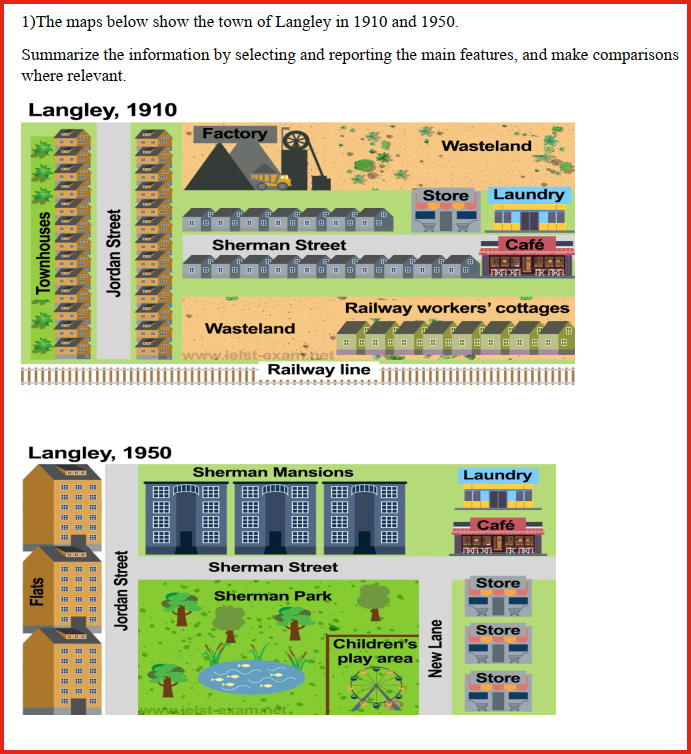
The two maps show the town of Langley in the years 1910 and 1950 and the urban developments that took place. Overall, there were a number of notable changes to the buildings and amenities of this area.
In 1910, the area had a combination of residential and industrial features, but by 1950 the industrial features had largely disappeared. Whereas in 1910 a railway line ran through the neighbourhood, by 1950 this had been removed. Furthermore, the townhouses which used to dominate the 1910 map had been replaced by blocks of flats by 1950, and the areas of wasteland had gone.
Another major change to the area in 1950 was the development of more commercial and recreational features. The demolition of a second row of houses on Sherman Street and the removal of the railway line made room for a spacious park and children's play area. On the commercial side, to the right of the park some new stores were built on the aptly named New Lane, replacing the small store of 1910, and the cafe and laundry were relocated.
To sum up, the area was renovated extensively, seeing fundamental changes to its residential accommodation, and its commercial and recreational facilities were developed
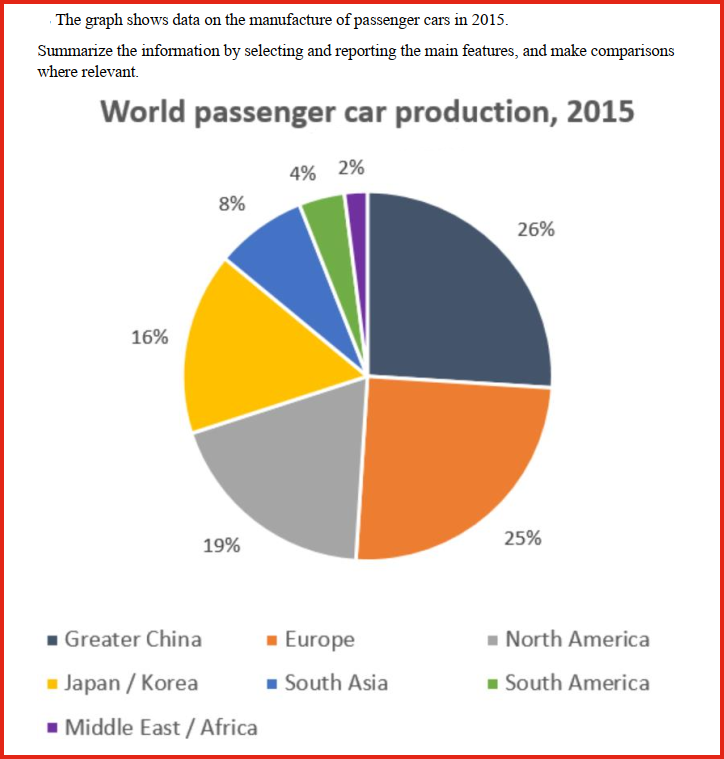
The pie chart gives the percentage of passenger cars manufactured by different regions of the world. For the purposes of this data set, the world is divided into seven regions.
What stands out is that the regions of Greater China and Europe lead the way in terms of the manufacture of passenger cars, with 26% and 25% respectively. By contrast, very few cars are produced in the Middle East and Africa: just 2% originate from that area.
Turning next to the Americas, a sharp contrast can be seen between the Northern and Southern parts of the continent. Whereas North America can boast 19% of the world's passenger car production, South America manufactures just 4% of this type of vehicle.
Finally, moving on to Japan and Korea, despite the fact that they are just two countries rather than a whole region, they account for a sizeable proportion of the total, at 16%
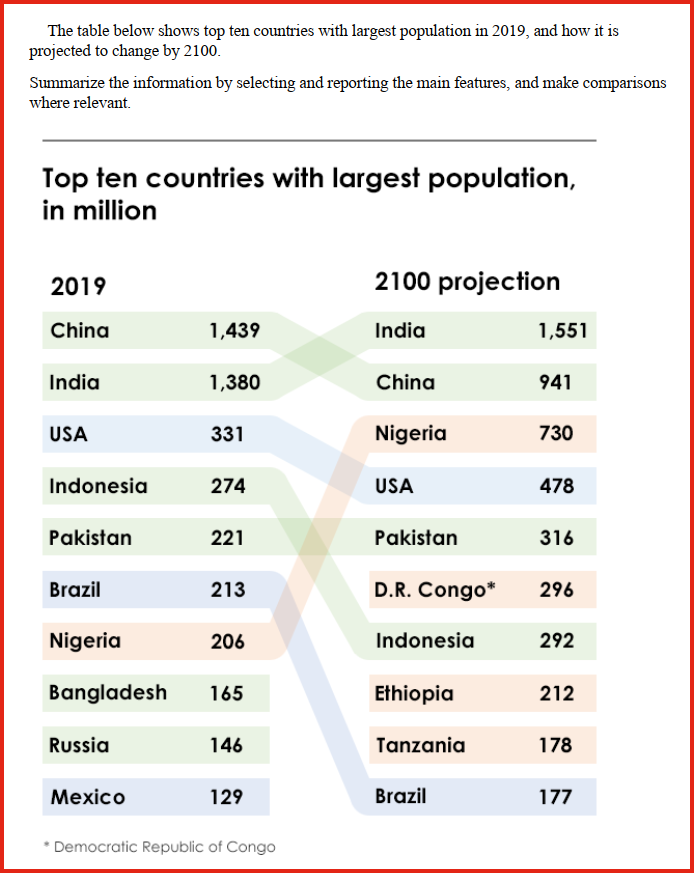
The table compares the population of the world's top ten countries in 2019 with projected numbers in 2100.
In 2019, China had the highest population of 1,439 million, with India second on 1,380 million. However, by 2100, India is projected to have the highest population of 1,551 million with China second on 941 million - down 498 million since 2019. Although the USA is projected to increase its population from 331 million to 478 million, it steps down from third to fourth place, being overtaken by Nigeria, which moves up from seventh place with 206 million, to a total of 730 million, representing a massive increase of 524 million. Brazil drops from sixth place in 2019 with 213 million, down to tenth in 2100 on 177 million - a decrease of 36 million.
Three of the ten most populous countries in the world will no longer be among the top ten in 2100, and all three will be supplanted by rapidly growing nations in Africa.
Except for China and Brazil, all other projections show an increase between 2019 and 2100, but there is a significant shuffling of position by some countries, the elimination of others, and the introduction of new contenders for a top-ten placing
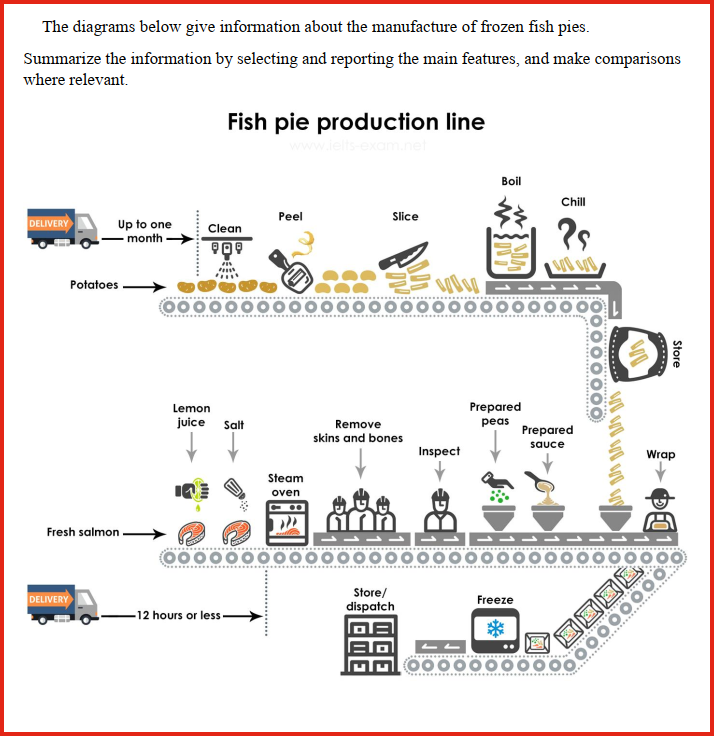
This diagram shows that there are a number of processes involved in the commercial production of frozen fish pies.
The main ingredients consist of fresh salmon, peas and sauce, with sliced potatoes, and they are prepared separately.
The potatoes, which may have been delivered up to a month in advance, are cleaned, peeled and cut into slices. The slices are boiled and then chilled before being stored until needed. The preparation of the fish is more labour intensive than the preparation of the potatoes. Within twelve hours of being delivered to the factory, the fresh fish is cooked by being steamed with lemon juice and salt. Then the skin and bones are removed by hand and disposed of, before a visual inspection takes place.
After this, the pies are assembled in microwaveable containers Peas and sauce, which have also been prepared, are added to the fish and then the pie is covered with a layer of cooked potato slices. The pies are then wrapped and frozen. At this point they are ready for dispatch, or they may be stored at the factory before being dispatched.
task 2

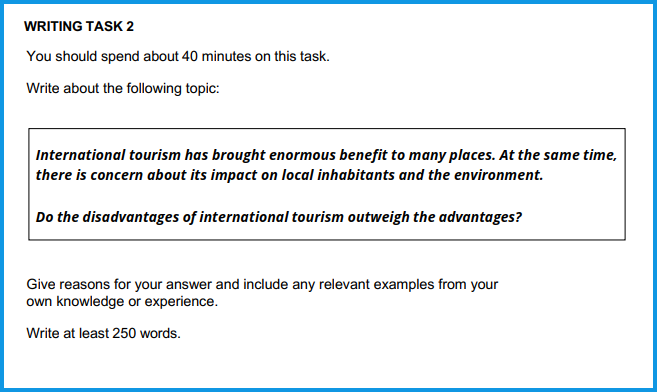
prompt before
Hi Petar,You mentioned you are thinking about working at my company. Let me explain the working conditions so you know what to expect.We work from Monday to Sanday. The free day you can pick up from Monday to Friday.The working day starts for the first shift at 07:00 AM to 14:00PM and for second shift from 14:00 PM to 21:00 PM. We have a 30 minutes for lunch break from 09:00 for first shift and from 16:00 PM for second shift. And we have coffe breaks a 10 minutes from 12:00 AM for first and from 19:00PM for second shift.We have 20 days for holidays and have one day for christams and one day for eastern. Every national day is double paid.